-
- Convergence of Digital and Carbon-neutral Technologies Strengthened with Signing of MoU between KR and HD Hyundai Global Service
- KR Launches XR-based Ship Familiarization Solution, KR-Real360
- New Autumn 2023 Issue of KR Decarbonization Magazine Published
- Successful Implementation and Operation of Autonomous Navigation Solution, Marking the Era of Autonomous Ships
- KR Approves New Wireless Communication System, metalVox
- KR awards AiP to Hanwha Ocean’s Onboard CO2 Capture System
-
- CCC 9 - News Flash
- Establishment of “Guidelines for Approval-In-Principle (AIP)
- Guidelines for Safe STS LNG Transfer Operation
- [2023-ETC-02] Technical Information for AFP-C(EV) Notation
- 9.184 Notice for Amendments to the KR Technical Rules (Rule Pt.4 Ch.10, Rule Pt.7 Ch.5, Guidance Pt.8 Ch.7, Guidance for Approval of Manufacturing Process and Type Approval
- Notice for Amendments to KR Technical Rules (Rule Pt.1, Guidance Pt.7 Annex 7-2)
- (EU) Port Information Concerning Waste for Ships During Port Calls in the EU
- Provision of Operational Information after a Flooding Casualty to Passenger Ships Constructed before 1 January 2014
- List of National Operational Contact Points for SOPEP/SMPEP (Latest Update: 31 October 2023)
- Considerations for Compliance with the Hong Kong Convention (HKC) (Entering into force on June 26, 2025) (Rev.1)
- The Status with Sulfur Content Regulations for Ship Fuel within Chinese Territorial Water
- Usage of Thuraya, Iridium and other such Satellite Communication in Indian Waters-Reg.
- Convergence of Digital and Carbon-neutral Technologies Strengthened with Signing of MoU between KR and HD Hyundai Global Service
- KR Launches XR-based Ship Familiarization Solution, KR-Real360
- New Autumn 2023 Issue of KR Decarbonization Magazine Published
- Successful Implementation and Operation of Autonomous Navigation Solution, Marking the Era of Autonomous Ships
- KR Approves New Wireless Communication System, metalVox
- KR awards AiP to Hanwha Ocean’s Onboard CO2 Capture System
- CCC 9 - News Flash
- Establishment of “Guidelines for Approval-In-Principle (AIP)
- Guidelines for Safe STS LNG Transfer Operation
- [2023-ETC-02] Technical Information for AFP-C(EV) Notation
- 9.184 Notice for Amendments to the KR Technical Rules (Rule Pt.4 Ch.10, Rule Pt.7 Ch.5, Guidance Pt.8 Ch.7, Guidance for Approval of Manufacturing Process and Type Approval
- Notice for Amendments to KR Technical Rules (Rule Pt.1, Guidance Pt.7 Annex 7-2)
- (EU) Port Information Concerning Waste for Ships During Port Calls in the EU
- Provision of Operational Information after a Flooding Casualty to Passenger Ships Constructed before 1 January 2014
- List of National Operational Contact Points for SOPEP/SMPEP (Latest Update: 31 October 2023)
- Considerations for Compliance with the Hong Kong Convention (HKC) (Entering into force on June 26, 2025) (Rev.1)
- The Status with Sulfur Content Regulations for Ship Fuel within Chinese Territorial Water
- Usage of Thuraya, Iridium and other such Satellite Communication in Indian Waters-Reg.
-
- Convergence of Digital and Carbon-neutral Technologies Strengthened with Signing of MoU between KR and HD Hyundai Global Service
- KR Launches XR-based Ship Familiarization Solution, KR-Real360
- New Autumn 2023 Issue of KR Decarbonization Magazine Published
- Successful Implementation and Operation of Autonomous Navigation Solution, Marking the Era of Autonomous Ships
- KR Approves New Wireless Communication System, metalVox
- KR awards AiP to Hanwha Ocean’s Onboard CO2 Capture System
-
- CCC 9 - News Flash
- Establishment of “Guidelines for Approval-In-Principle (AIP)
- Guidelines for Safe STS LNG Transfer Operation
- [2023-ETC-02] Technical Information for AFP-C(EV) Notation
- 9.184 Notice for Amendments to the KR Technical Rules (Rule Pt.4 Ch.10, Rule Pt.7 Ch.5, Guidance Pt.8 Ch.7, Guidance for Approval of Manufacturing Process and Type Approval
- Notice for Amendments to KR Technical Rules (Rule Pt.1, Guidance Pt.7 Annex 7-2)
- (EU) Port Information Concerning Waste for Ships During Port Calls in the EU
- Provision of Operational Information after a Flooding Casualty to Passenger Ships Constructed before 1 January 2014
- List of National Operational Contact Points for SOPEP/SMPEP (Latest Update: 31 October 2023)
- Considerations for Compliance with the Hong Kong Convention (HKC) (Entering into force on June 26, 2025) (Rev.1)
- The Status with Sulfur Content Regulations for Ship Fuel within Chinese Territorial Water
- Usage of Thuraya, Iridium and other such Satellite Communication in Indian Waters-Reg.
Alternative Fuel Technology Research Team
RO Gilltae
KIM Kyunghwa
PARK Kido
MOON Changjae
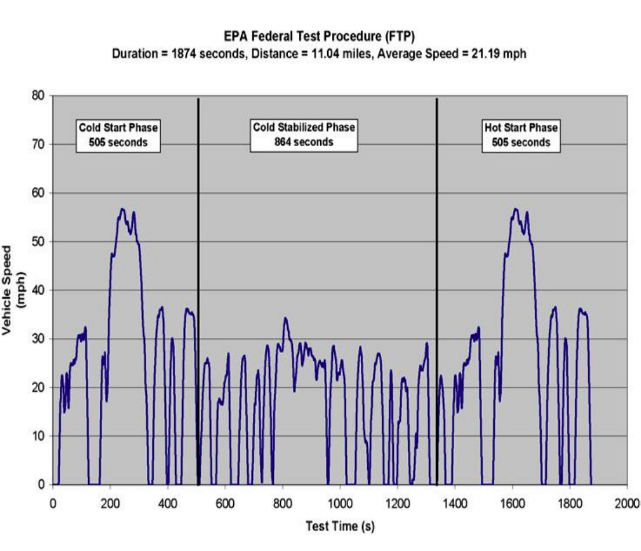
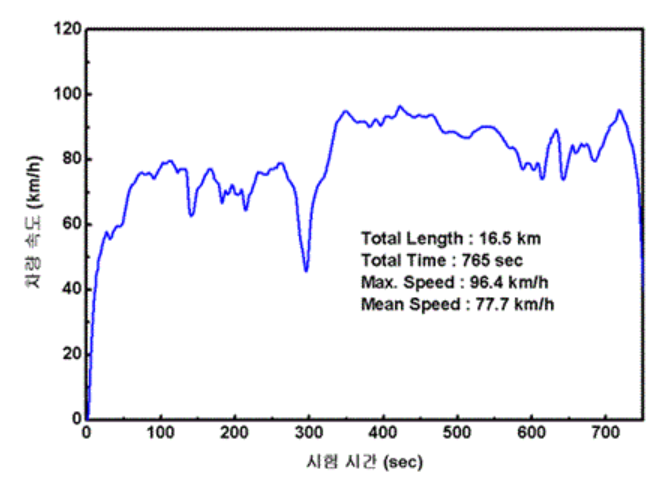
The KR Alternative Fuel Technology Research Team is currently carrying out the R&D development project “Development of mobility driving mode for expansion of fuel cell system hybrid power system” funded by the Ministry of Trade, Industry & Energy (MOTIE, Korea). The shipbuilding and shipping industry's research into sailing mode development is limited. While it's feasible to adapt the actively researched car driving mode concept to ships, the distinct operating environments of cars and ships make direct application challenging. Therefore, developing a method to derive ship-specific sailing modes and a system for generating representative sailing modes is essential. To this end, we analyzed the Federal Test Procedure-75 mode (city driving mode) and Highway Fuel Economy Test mode (highway driving mode), both used in the automotive industry with the 5-cycle correction formula, alongside the Busan-Masan-Busan route profile of Korea Maritime and Ocean University's training ship Hanara. Figures 1 and 2 show the speed profiles for the FTP-75 and HWFET modes, respectively, while Figure 3 presents the speed and power profile of the training ship Hanara.
|
|
Figure 1 . FTP-75 Mode Speed Profile | Figure 2. HWFET Mode Speed Profile |
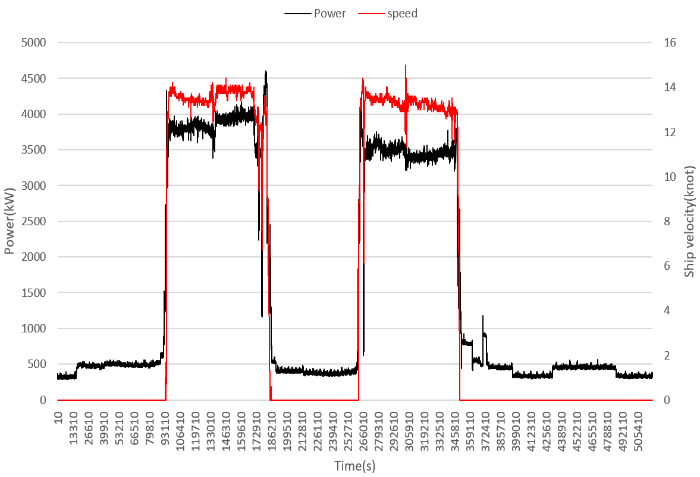
Figure 3. Power and Speed Profile of the Training Ship for the Busan–Masan–Busan Voyage
To analyze each mode in the automobile and ship profiles, RPA and PKE were calculated. RPA (Equation (1)) is defined as the relative positive acceleration, and PKE (Equation (2)) is defined as the positive kinetic energy. RPA and PKE were used as parameters to analyze the driving dynamics. The higher the RPA and PKE values, the greater the dynamic change. As presented in Table 1, for automobiles, RPA and PKE were larger for FTP-75 than for HWFET, implying that the load variability of FTP-75 was higher than that of HWFET. For ships, RPA and PKE were larger in the leaving-port (Busan) mode than Ocean-going-1 mode, indicating that the load variability of the leaving-port (Busan) mode was higher than that of Ocean-going-1. Notably, the Leaving-port (Busan) mode accelerated sharply up to 90% of the sailing speed and then accelerated gradually, whereas in the Ocean-going-1 mode, the power values moved up and down relative to the horizontal line, which is a constant power. This creates significant differences between the calculated RPA and PKE values and the calculated values for each mode are presented in Table 1.

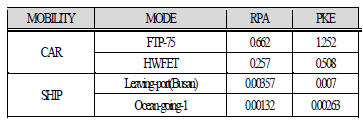
Table 1. RPA and PKE for Various Modes of the Car and Ship
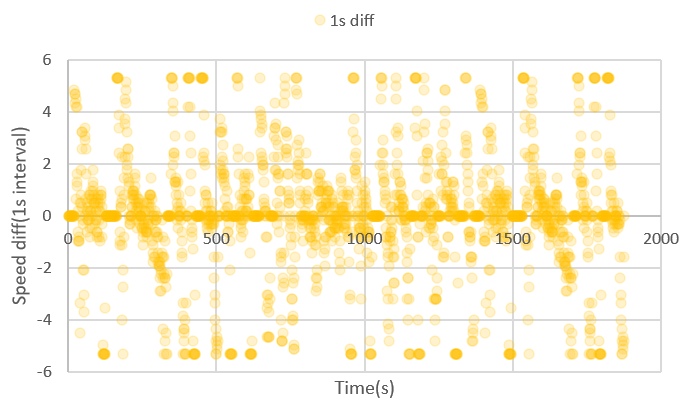
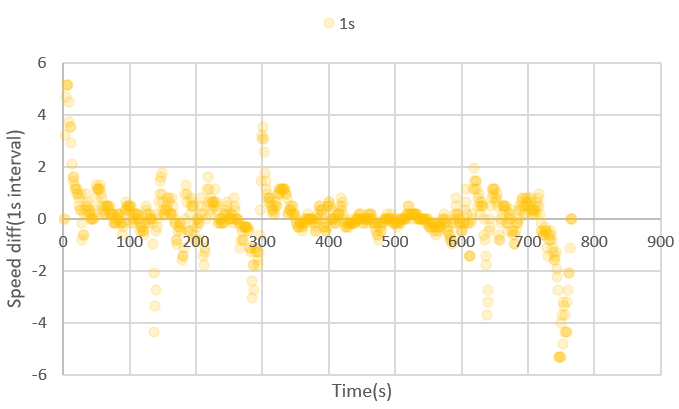
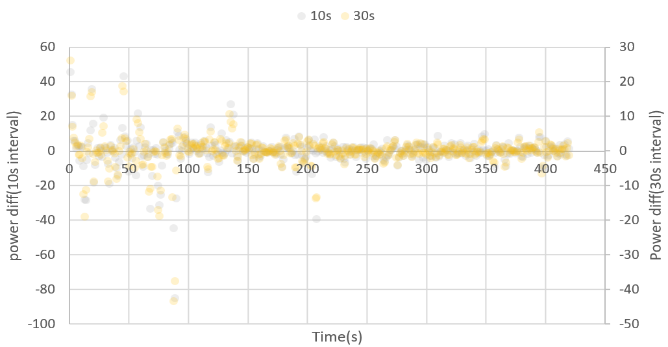
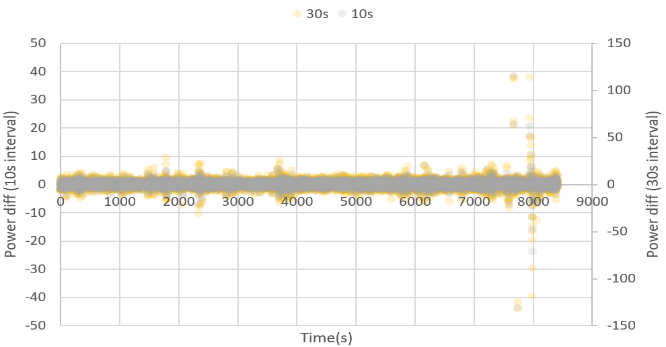
Figures 4 and 5 present scatter plots of the speed differential of an automobile in the FTP-75 mode (city driving mode) and HWFET mode (highway driving mode), with speed values measured in km/h and separated by 1 s intervals. The FTP-75 mode resulted in greater dispersion than the HWFET mode. This is evident from the number of sharp accelerations and decelerations related to the dynamics in the FTP-75 mode compared to those in the HWFET mode. Figures 6 and 7 show scatter plots of power differentials for the leaving-port (Busan) mode and Ocean-going-1 mode of the training ship at 10 and 30 s intervals. In the Leaving-port (Busan) mode, the points were scattered near y = 0, whereas in the Ocean-going-1 mode, the points were close to y = 0. This implies that the leaving-port (Busan) mode is more dynamic than the Ocean-going-1 mode.
|
|
Figure 4. Scatter Plot of Speed Differential in the FTP-75 Mode | Figure 5. Scatter Plot of Speed Differential in the HWFET Mode |
|
|
Figure 6. Scatter Plot of Speed Differential in the Leaving-port (busan) Mode | Figure 7. Scatter Plot of Speed Differential in the Ocean-going-1 Mode |
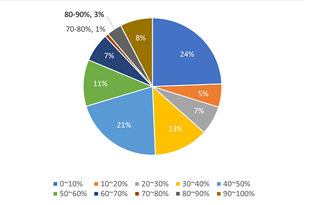
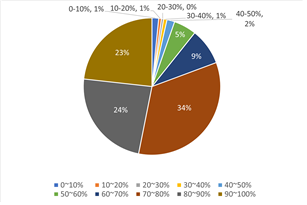
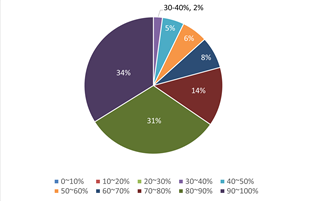
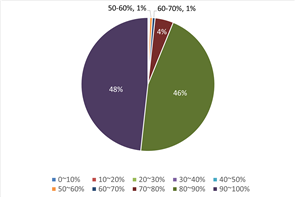
Figure 8 shows the load ratio for each part after the maximum speed of the FTP-75 mode, which was divided into ten equal parts. The ten sections were evenly distributed without bias. This indicates that the load proportion was distributed evenly because the FTP-75 mode had several ITI cycles. Figure 9 shows the load ratio for each part after the maximum speed of the HWFET mode was divided into ten equal parts. Evidently, the 70–100% load section occupies most of the load (81%) in the HWFET mode. This indicates that after the automobile accelerated sharply to the maximum speed in the HWFET mode, it maintained that speed. Figure 10 shows the load ratio for each part after the maximum power of the leaving-port (Busan) mode was divided into ten equal parts. The 70–100% load section occupied most of the load (79%) in the leaving-port (Busan) mode. This implies that after the training ship accelerated sharply to the maximum power of the leaving-port (Busan) mode, it continued to accelerate gradually by the maximum power of the Leaving-port (Busan) mode. Figure 11 shows the load ratio after the maximum power of the Ocean-going-1 mode was divided into ten equal parts. The 80–100% load section occupied most of the load (94%) in the Ocean-going-1 mode. This implied that the training ship consistently maintained a pace near the maximum power of the Ocean-going-1 mode. The analysis results of each mode in automobiles and ships show that each mode has different characteristics, such as load distribution and acceleration segments, and each mode must be defined to develop a representative mode based on probability.
|
|
Figure 8. Percentage of the Load Proportion at Constant Intervals in the FTP-75 Mode | Figure 9. Percentage of the Load Proportion at Constant Intervals in the HWFET Mode |
|
|
Figure 10. Percentage of the Load Proportion at Constant Intervals in the Leaving-port (Busan) mode | Figure 11. Percentage of the Load Proportion at Constant Intervals in the Ocean-going-1 Mode |
As there is no concept of sailing mode in the shipbuilding and shipping industry, we developed a sailing mode deriving algorithm based on the concept of driving mode in the automobile industry. To develop a feasible methodology for the sailing mode development in future studies, we introduced concepts that do not exist in the driving mode. Based on the results of analysis on the car and the ship, we present an algorithm for deriving the ship sailing mode, as shown in Figure 12. First, the purpose of each sailing mode was determined. After determining whether it is suitable for measuring the fuel efficiency or ship design, the sailing mode must be derived. The type of ship, sailing route (area), and y-axis values were selected, and the corresponding data were obtained from the ship and then preprocessed. Based on the preprocessed sailing profile, the sailing modes can be derived from the gathered sailing profile based on the criteria such as ship function, speed, power, ELA and so on.
There is an example for the training ship Hannara. The fuel efficiency measurement mode was selected for the sailing profile of the training ship and South Sea nearshore area (Group 1). The sailing mode is derived based on the function, speed, power, and ELA of the ship. In the arrival and departure modes, the sailing mode is divided into parts where the speed was 0 with changing ship power, and where the speed was not 0 with gradually changing power, through which we additionally derived the anchoring, rapid acceleration during navigation, rapid deceleration during navigation, and ocean-going modes. Table 2 presents the types of derived sailing modes and Figure 13 presents the profiles of the main engine power, generator power, total power (main engine power and generator power), and ship speed for each mode.
○ Sailing-mode name and Type:
Fuel Efficiency Measurement: Training Ship – Group 1 (Busan–Masan–Busan voyage)
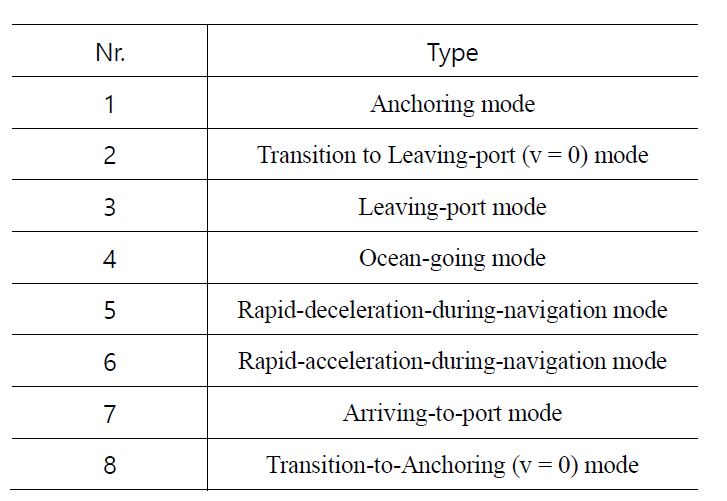
Table 2. Types of Sailing Modes for the Training Ship
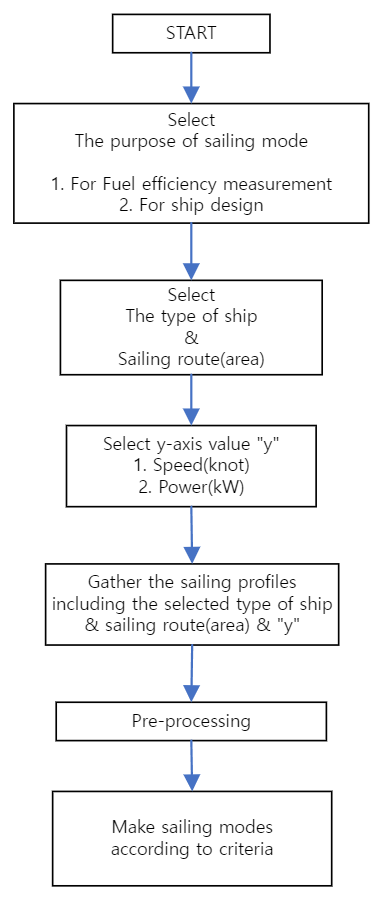
Figure 12. Algorithm for deriving the sailing modes
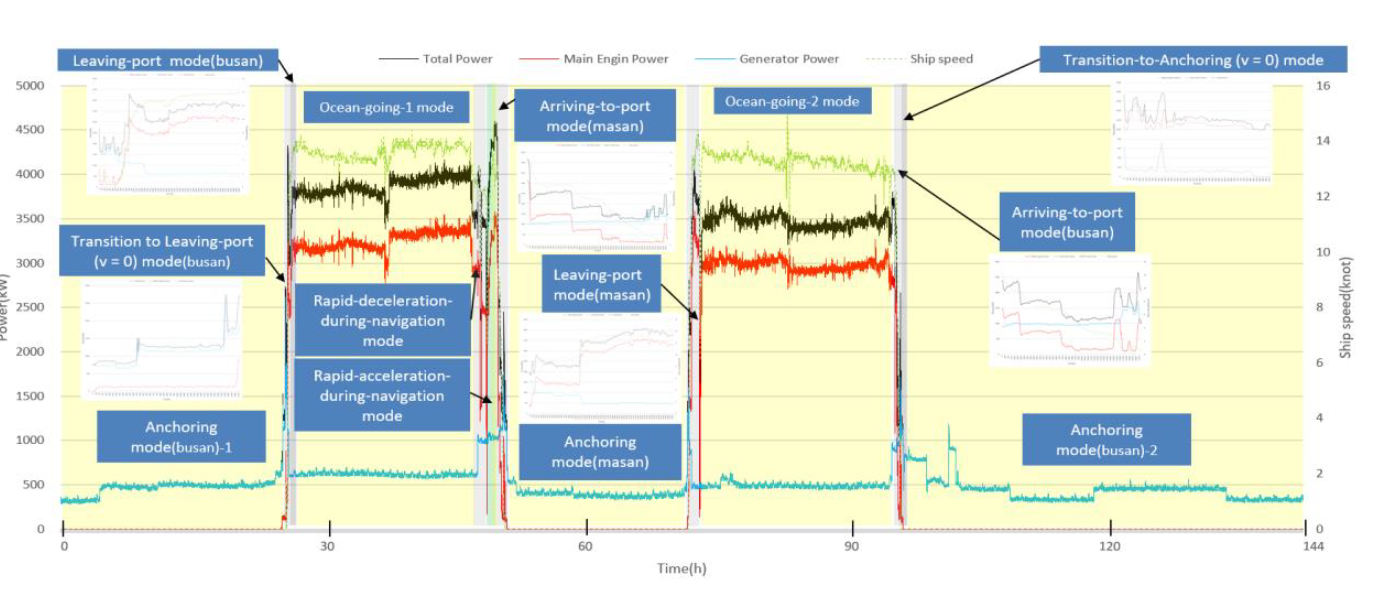
Figure 13. The Profile of Each Mode in Busan–Masan–Busan Voyage
After deriving sailing modes from the sailing profile according to the above algorithm in Figure 12, the representative sailing mode must be created. Referring to the car driving mode generation methodologies. There are many methodologies such as analyzing real-road driving patterns and reconstructing speed distribution, defining stop, acceleration, and deceleration fragments and using the Monte Carlo method based on the probability of each fragment, and traditional methods that use micro-trips and so on. As a result of applying each methodology to ships, the sailing mode generation methodology based on probability using MCMC (Markov Chaing Monte Carlo) was most suitable for ship sailing patterns. As shown in Figure 14, Various sailing profiles are derived into one representative sailing profile through the sailing mode generation methodology based on the probability and the core of this methodology is a MCMC (Markov Chain Monte Carlo) algorithm.
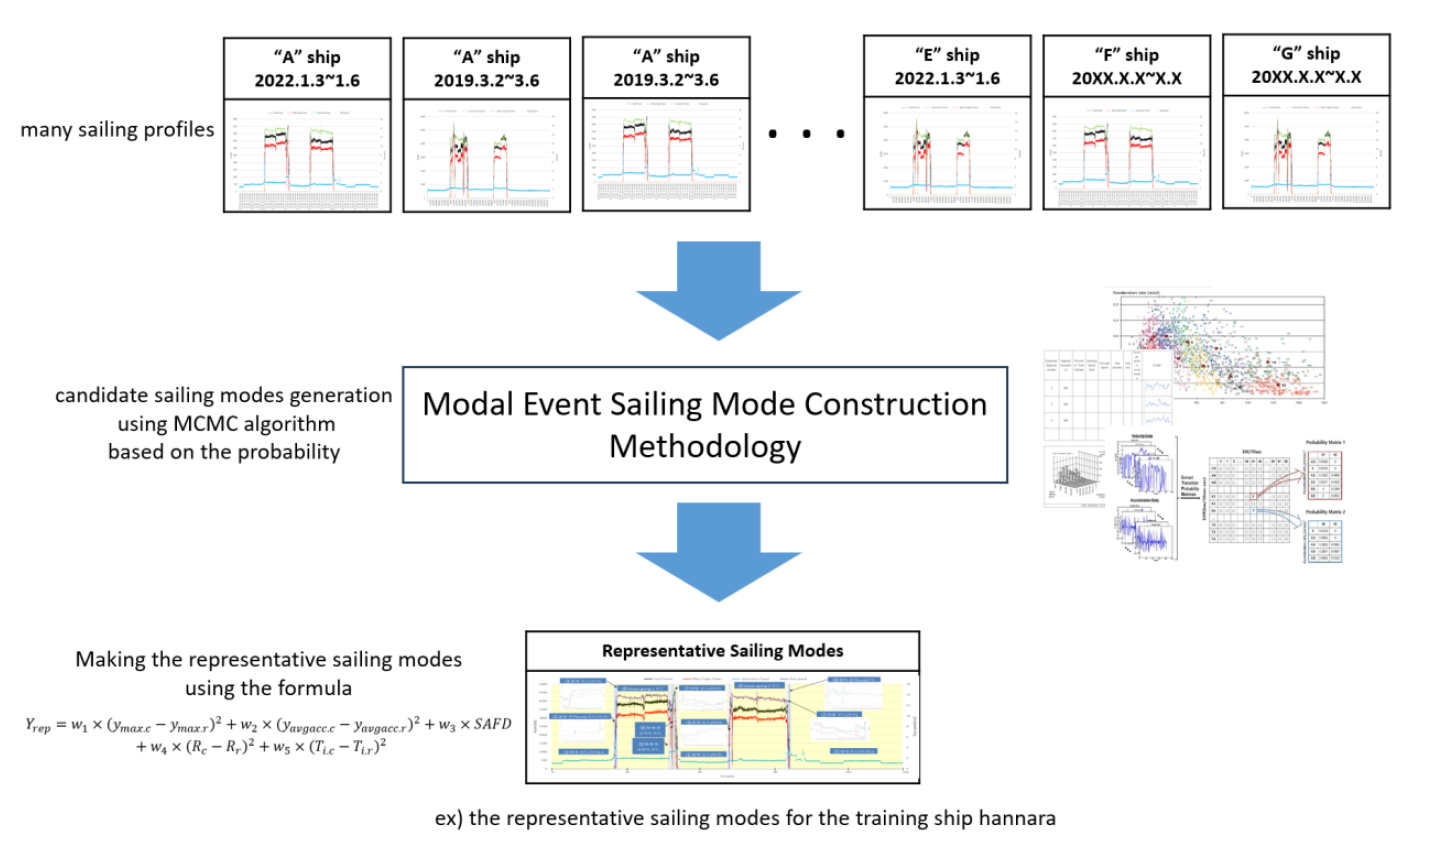
Figure 14. Generation of the Representative Sailing Modes using MCMC
A Markov Chain is a discrete probability process and when it passes from one state to another, It is a stochastic process that is affected only by the state of the previous step. Because the future is independent from the past and is influenced only by the previous point in time, it is suitable for creating a ship sailing mode and can be expressed as Equation 3 below.

Currently, KR has completed the development of matlab modeling related to representative sailing mode generation methodology using MCMC based on the probability and in the future, KR plan to create representative sailing modes from sailing profiles of container ships and passenger ships. The findings are applicable not only to the training ship but also to other vessels. They also provide foundational data for developing methodologies to generate representative sailing modes. These methodologies are based on the likelihood of consolidating various sailing profiles from different ship types into one representative mode. Furthermore, the representative sailing modes, tailored for specific waters and routes, can be utilized in designing optimization systems for new ships and in measuring standardized fuel efficiency across ships with diverse sailing profiles.

